Nasdaq set for worst first-half on record
A bear market that began on the first trading day of 2022 has the S&P 500 on track for its worst first half in 52 years. Investors looking ahead to the end of the year might have some reason for hope, though history is only a rough guide.
The S&P 500 SPX was down 19.9% year-to-date through Wednesday’s close, which would be its worst first half since 1970, according to Dow Jones Market Data.
The large-cap benchmark is down 20.4% from its record finish on Jan. 3. The index earlier this month first ended more than 20% below that early January record, confirming that the pandemic bull market — as widely defined — had ended on Jan. 3, marking the start of a bear.
The S&P 500 has bounced around 4% off its 2022 low close of 3,666.77 set on June 16.
Data compiled by Dow Jones Market Data shows that the S&P 500 has bounced back after past first-half falls of 15% or more. The sample size, however, is small, with only five instances going back to 1932 (see table below).
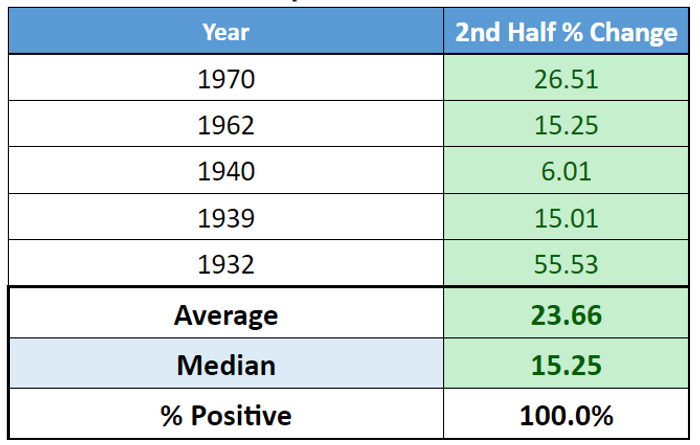
The S&P 500 did rise in each of those instances, with an average rise of 23.66% and a median rise of 15.25%.
Investors, however, may also want to pay attention to metrics around bear markets, particularly with the will-it-or-won’t-it speculation around whether the Federal Reserve’s aggressive tightening agenda will sink the economy into recession.
Indeed, an analysis by Wells Fargo Investment Institute found that recessions accompanied by a recession, on average, lasted 20 months and produced a negative 37.8% return.
Bear markets outside a recession lasted 6 months on average — nearly the length of the current episode — and saw an average return of -28.9%. Taken together, the average bear market lasted an average of 16 month and produced a -35.1% return.
Other major indexes are also set to log historic first-half declines.
The Dow Jones Industrial Average DJIA was down 14.6% in the year to date through Wednesday, which would be its biggest first-half fall since 2008.
As the table below shows, the second-half performance for the blue-chip gauge after first-half declines of 10% or more are variable. The most recent incident, in 2008 during the worst of the financial crisis, saw the Dow drop another 22.68% in the second half of the year.
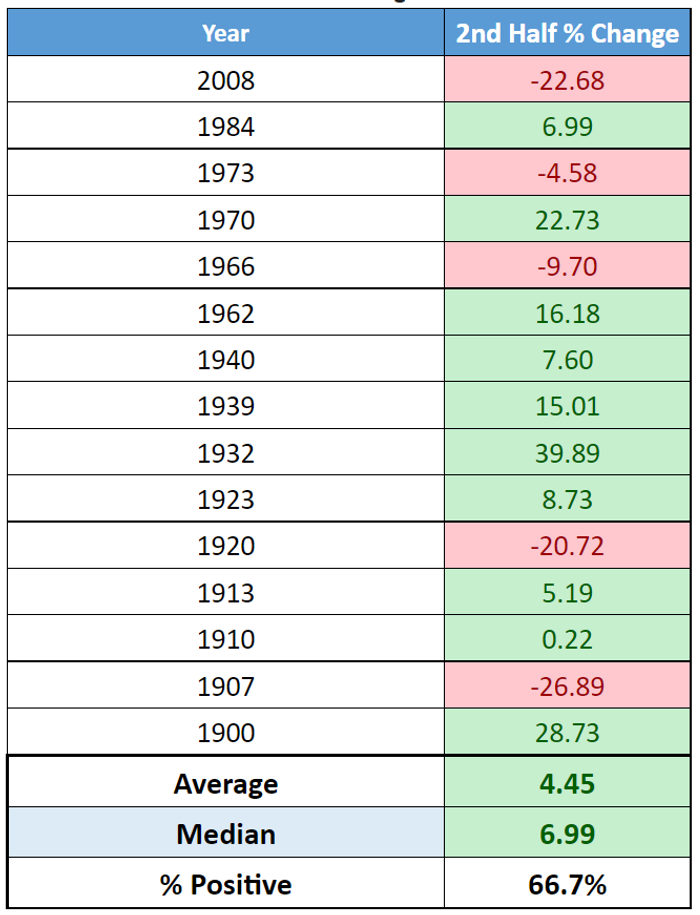
In the 15 instances, the Dow rallied in the second half two-thirds of the time, producing an average second-half rise of 4.45% and a median gain just shy of 7%.
The tech-heavy Nasdaq Composite COMP was down 28.6% year-to-date through Tuesday’s finish, but there was little to go on when Dow Jones Market Data looked back at first-half drops of at least 20% for the gauge.
There were only two instances — 2002 and 1973 — and both saw the Nasdaq keep sliding over the remainder of the year, falling around 8.7% over the second half in both instances.
Source: marketwatch.com